Beating Debt with a Balance Sheet
 By Chris Moriarity, MA, FA, VP of Client Development
When it comes to finance, the profit and loss statement (P&L) gets a lot of attention. This wonderful document helps define and explain the path that every dollar that comes in your office takes. It’s like the Plinko board of business, a dollar goes in the top and hopefully something comes out at the bottom. We call those dollars “profits” and we like those dollars the most.
The problem is the P&L often becomes the single financial instrument being used to measure the office. Now, you don’t meet too many docs with accounting degrees, so it’s natural to have some apprehension around exploring other financial tools, but let’s just start with one.
The Balance Sheet
“Debt is the slavery of the free.” – Publilus Syrus
What is a balance sheet? It’s a statement of the assets, liabilities, and capital of a business at a specific point in time, detailing the balance of income and expenditure over the preceding period…blah blah blah, snore snore snore.
The reason you’re going to learn about the balance sheet is simple. Debt management.
From a pure economics sense, there is good debt and bad debt. An oversimplified distinction would that bad debt is debt incurred to buy time or perpetuate the status quo. Good debt is debt that might create production leverage. Let’s say you own a pizza parlor and your current oven can produce ten pizzas an hour. However, your wait-times are too long for potential customers so you’re losing business. Good debt would be purchasing a new or second oven that will increase your production capacity and potentially provide some tax benefit.
Ratios – Liquidity Ratio
You should review your balance sheet once a quarter. Rather than just scanning it, there are a couple of simple calculations you can use to get some amazing insight into the health of your business. What we’ll be looking at are “liquidity ratios” that measure the ability of your business to pay short-term debt, which is any debt that should be paid off within 12 months.
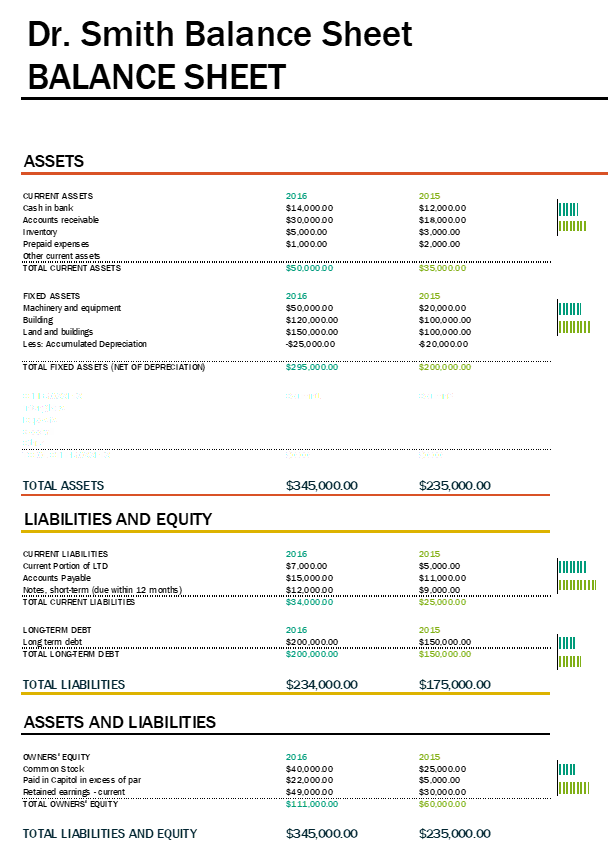
To keep us all on the same page, we’re going to use this sample balance sheet (you can get your own balance sheet from your accountant):

Current Ratio
Also known as the ‘working capital’ ratio, current ratio is simply found by taking the Current Assets and dividing it (noted with a “/”) by Current Liabilities. The higher the number, the better.
From our Balance Sheet
- 2016 Current Ratio = 50,000/34,000 = 1.47
- 2015 Current Ration = 35,000/25,000 = 1.4
This means for every $1.00 in current 2016 liabilities, they have $1.47 to cover it. The average is $1.15. The most important thing to remember is tracking this over time and watching the trends.
Quick Ratio (aka Acid Test)
This ratio is the same equation as above minus the inventory and prepaid accounts.
Acid Test = (Cash Equivalents + Marketable Securities + net receivables) divided by Current Liabilities
From our Balance Sheet:
- 2016 Acid Test = (14,000 + 30,000)/34,000 = 1.29
- 2015 Acid Test = (12,000 + 18,000)/25,000 = 1.2
If the difference is significant, it could point to a bloated inventory. The logic behind the Acid Test is simple. If you needed cash tomorrow, what’s the likelihood you could sell your supply of cotton rolls to drum up some cash? Yeah, not gonna happen. So, this tends to be a slighty clearer picture of your financial position in a quick and dirty fashion.
Long-Term Debt Ratio (LTD)
This is the measure of the businesses ability to handle and meet long-term debt obligations, those debts that will be paid beyond 12 months.
From our Balance Sheet
- Debt ratio= Total Liabilities/Total Assets
- Debt ratio = 234,000/395,000 = 59.24%
This means that 59.24% of our assets are financed by the liabilities. The higher the number…the closer to BAD.
Start Today
There are many ways that your balance sheet can helpful, and this list of ratios is by no means exhaustive, but it’s a great place to start. These trends can be a wonderful predictor of tough times ahead, or a great sign that you’re on the right track. Debt repayment isn’t sexy or fun, but establishing trends builds momentum, and that gets additive. These numbers get fun and you’ll be amazed how much you’re bank account will reflect positive shifts.
It doesn’t matter where you start, it only matters that you start. I recommend starting today.
Harness Your Debt
If you need help understanding where your practice is financially and how to use your numbers to pay off debts, fill out the form below for your Complimentary Practice Discovery. In your Discovery, we’ll take a look under the hood of your practice, run a diagnostic, and identify the areas that could use improvement.
Have a great experience with PDA recently?
Download PDA Doctor Case Studies


